To read the full article on ESRI’s website, click here.
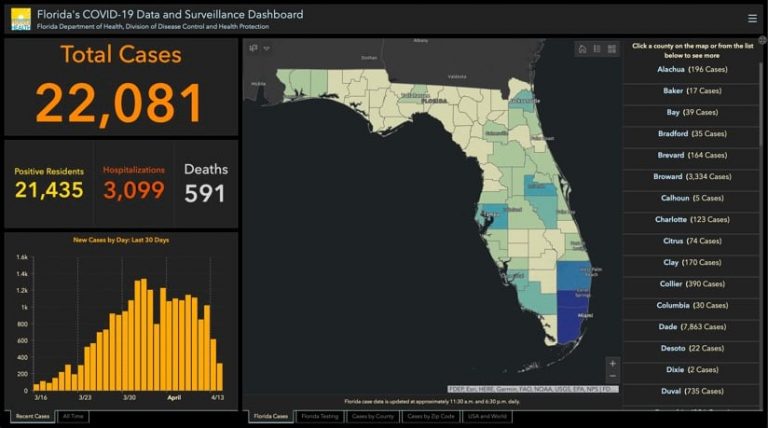
Florida’s COVID-19 Data and Surveillance Dashboard provides clear communication as well as the data that drives decision-making.
Key Takeaways
- Florida Department of Health’s dashboard is the public face of the state’s COVID-19 response effort.
- Opening data to researchers allows many experts to run models and offer insights.
- Close collaboration fostered in past disasters improves response efforts.
Partyers and retirees clashed in Florida recently as the novel coronavirus disease 2019 (COVID-19) spread across the US. Though residents 65 years of age and older make up more than 20 percent of the state’s population (compared to 15 percent for the nation), the rush of college students to Florida beach towns for spring break temporarily changes that ratio.
As young revelers crowded Florida beaches and retirees observed the lack of social distancing, a dedicated scientist was hard at work quantifying the state’s COVID-19 cases. She knew seeing up-to-date data for the state would help local authorities and residents make decisions to reduce the impacts of the disease. She also hoped the data would reduce the feeling of panic in older and more vulnerable residents.
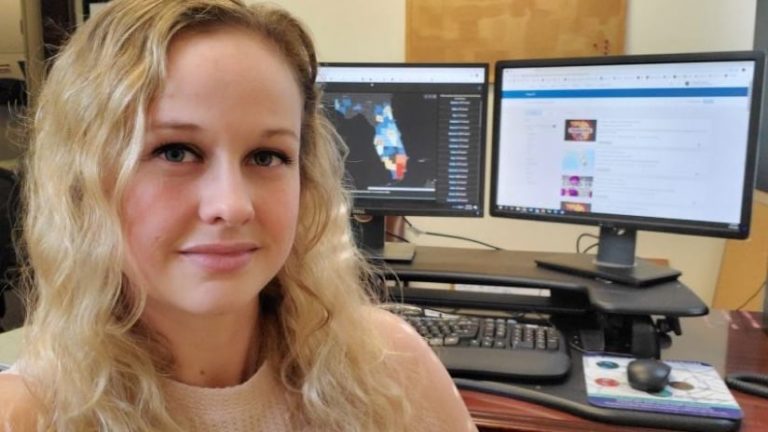
“We have a very large vulnerable population, more so than any other state,” said Rebekah Jones, GIS manager for the Florida Department of Health. “One good thing we’ve seen so far is that the bulk of areas where that population lives hasn’t been hit as hard by the virus.”
Jones is usually working on other types of GIS maps and analysis—tracking environmental factors such as radon and water quality and making sure health services reach women, infants, children, and the elderly. She put that work on hold and quickly created a COVID-19 dashboard. Then, she spent the weekend compiling case data and configuring the dashboard.
Just days after completion, Florida’s COVID-19 Data and Surveillance Dashboard was launched by the governor on live national television, much to Jones’ surprise. Her hard work delivered an authoritative source for timely and accurate case reporting, and within a few weeks, it had been viewed 44.7 million times.
Data-Driven Dashboards
With her education and experience, Jones was well poised to build the dashboard. She completed dual majors in geography and journalism for her undergraduate degree from Syracuse University, earned a master’s degree in geography with a minor in mass communications from Louisiana State University with a focus on crisis communication, and has completed coursework for a PhD in geography from Florida State University with an emphasis on data science.
Now, she manages data and surveillance and performs analysis, modeling, and mapping for the Florida Department of Health.
Jones was careful about the design of the COVID-19 dashboard. She wanted it to be easy to use and also bring the data to life. The dashboard is driven by a large database used by hospitals, doctors’ offices, labs, and health department offices statewide. It shows the total cases in Florida, the number of residents and non-residents who have tested positive in the state, the number of people being monitored, and the number of deaths, along with other details.
“You’ll notice the dashboard has a lot of oranges, yellows, and blues—Florida colors—because I didn’t want to frighten people,” Jones said. “I had to fight to keep from putting red anywhere. People are terrified, and red initiates a primal feeling of fear.”
Modeling Trends and Provisioning Fellow Scientists
The Florida Department of Health has three separate teams running models about the spread of the virus. These teams are working with the same data that supports the dashboard.
“The teams are intentionally separated from each other,” Jones said. “After we all run our models and get back together, we compare results, and if our results vary, we dig into determinants. If we find a single factor that makes cases worse in a location, we recommend a mitigation strategy.”
With fellow scientists in mind, Jones packaged data for academic and private researchers who are also creating models to help predict and explore impacts. She recently uploaded data at the subcounty level for each ZIP code to enhance accuracy.
“If you look at our data services, there’s a lot of publicly available data, because it’s critical information,” Jones said. “We would much rather the public or the press have the data that we’ve triple checked than to scrape the web trying to count cases or have a research group or university create a model with data that we haven’t verified. The efforts in the academic community to do serious data modeling are crucial right now.”
For the research community, Jones has been careful to document details about the data, providing a guide that explains every field and how it’s calculated. This information also comes with clearly communicated caveats and limitations. For instance, virus recovery data doesn’t appear on Florida’s dashboard because it’s a data point that scientists have trouble defining.
“Recovery can mean a lot of things, and it’s a contested issue,” Jones said. “Are you recovered once you’re no longer symptomatic, contagious, or no longer require hospitalization? We would need to test everyone again to make sure they’ve recovered, and we don’t have enough test kits for that.”
Tracing and Quantifying the Disease
Epidemiologists are also using maps to analyze associations among location, environment, and disease. The spatial analytics and visualization capabilities of GIS are particularly well suited to this task.
“We work to connect known cases to possible infectious places and people,” Jones said. “This analysis includes mapping the roads and possible facilities, such as grocery stores, that connect people. Your home address doesn’t tell us who you might have infected nearly as much as what bus route you take to work each day, which gas stations you may stop at, or where you buy your groceries.”
The work on spread modeling to pinpoint case origin and connections continues to be an important input to help slow the pandemic. This analysis also reinforces the effectiveness of social distancing, which got a boost when Florida’s governor closed beaches across the state.
Closure of state beaches supported social distancing rules and put an end to beach parties, allowing seniors to breathe a sigh of relief. When spring break was over, the seniors had to think more critically about the actions of their peers. The biggest challenges for the Department of Health right now are continued dining in restaurants and large gatherings at big churches.
In late January of this year, Jones read an academic paper warning about the virus. When the Johns Hopkins dashboard came out, she monitored it closely and watched as the number of cases began to rise and spread.
“In late January, I was bugging everyone in the Department of Health to let me do this,” Jones said. “Finally, on March 10, the governor’s office called and wanted a dashboard. With my odd background in science, mapping, and communication, I was the right person at the right place at the most horrible time. We’ve added things and changed it here and there, but I continue to keep in mind the information the public wants to know and the data researchers need to do an analysis right.”
Learn more about how Models and Maps Explore COVID-19 Surges and Capacity to Help Officials Prepare and read the white paper Geographic Information Systems for Coronavirus Planning and Response. Listen to podcast conversations with Este Geraghty, Esri Chief Medical Officer and Ryan Lanclos, Esri Director of Public Safety Solutions. See the COVID-19 GIS Hub for location intelligence resources. The Coronavirus Response solutions page provides a collection of maps and apps that can be used by public health agencies to understand the virus’s impact and share information about the pandemic with your community.
Hurricane Response Fosters Close Collaboration
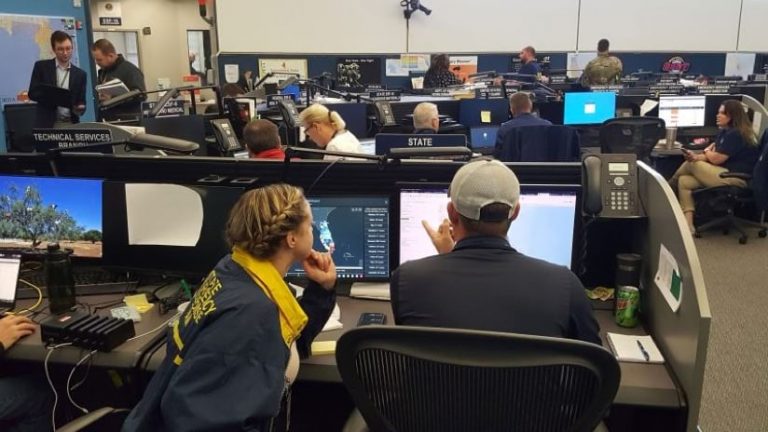
The constant need to prepare for hurricanes drives tight collaboration across the emergency response community in Florida. GIS administrators for the Florida Division of Emergency Management and the Florida Department of Health work closely together with guidance and support from the state’s geographic information officer. The state, in turn, provides data and modeling support to GIS personnel at county and local levels through the Geospatial Assessment Tool for Operations & Response (GATOR).
“We have a similar battle rhythm now as during a hurricane activation; however, the meetings and the discussion topics have changed to focus directly on this public health emergency,” said Jason Ray, GIS administrator and acting chief information officer at the Florida Division of Emergency Management. “We are utilizing our WebEOC instance for local resource requests and mission management, as we typically do during a hurricane response, while pushing data to ArcGIS Online to create dashboards that provide situation awareness to state and county emergency response teams.”
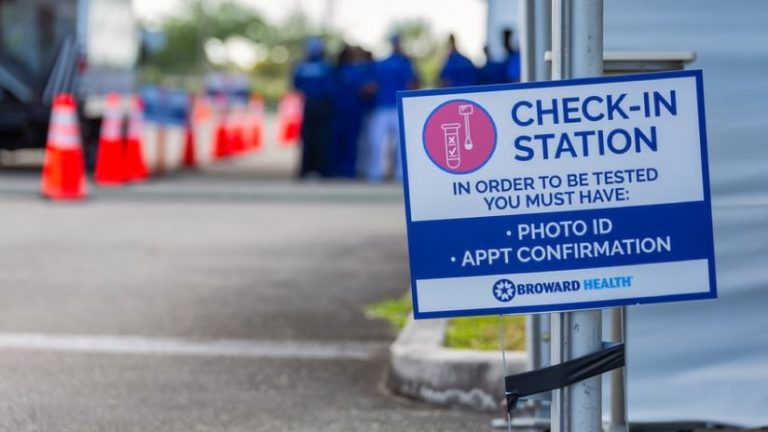
Ray and his team have been using WebEOC to coordinate testing center sites while addressing available supplies and county requests for personal protective equipment, analyzing hospital capacity data from the Agency for Health Care Administration, and utilizing COVID-19 case data to build dashboards for the State Emergency Operations Center.
“We share data and analysis because we trust each other and know that analysis needs to start moving quickly to potentially save lives,” said Rebekah Jones, GIS manager for the Florida Department of Health.
Ray and Jones have worked together during past hurricanes, and with the recent forecast of a more active hurricane season starting in June, they have begun to consider how to conduct an evacuation during a pandemic. They have the most concern for individuals who rely on public transit and hospital patients who may need to be moved out of harm’s way.

